Purpose
The purpose of this project was to visualize the differences between the magnitudes of earthquakes all over the world for the last seven days, as well as the tectonic plates around the globe.
Execution
GeoJSON earthquake data was pulled from the USGS website and retrieved geographical coordinates and the magnitudes of earthquakes for the last seven days. The data was then mapped, and various map styles were used. The user can toggle the earthquake markers or tectonic plate lines on-and-off.
Examples
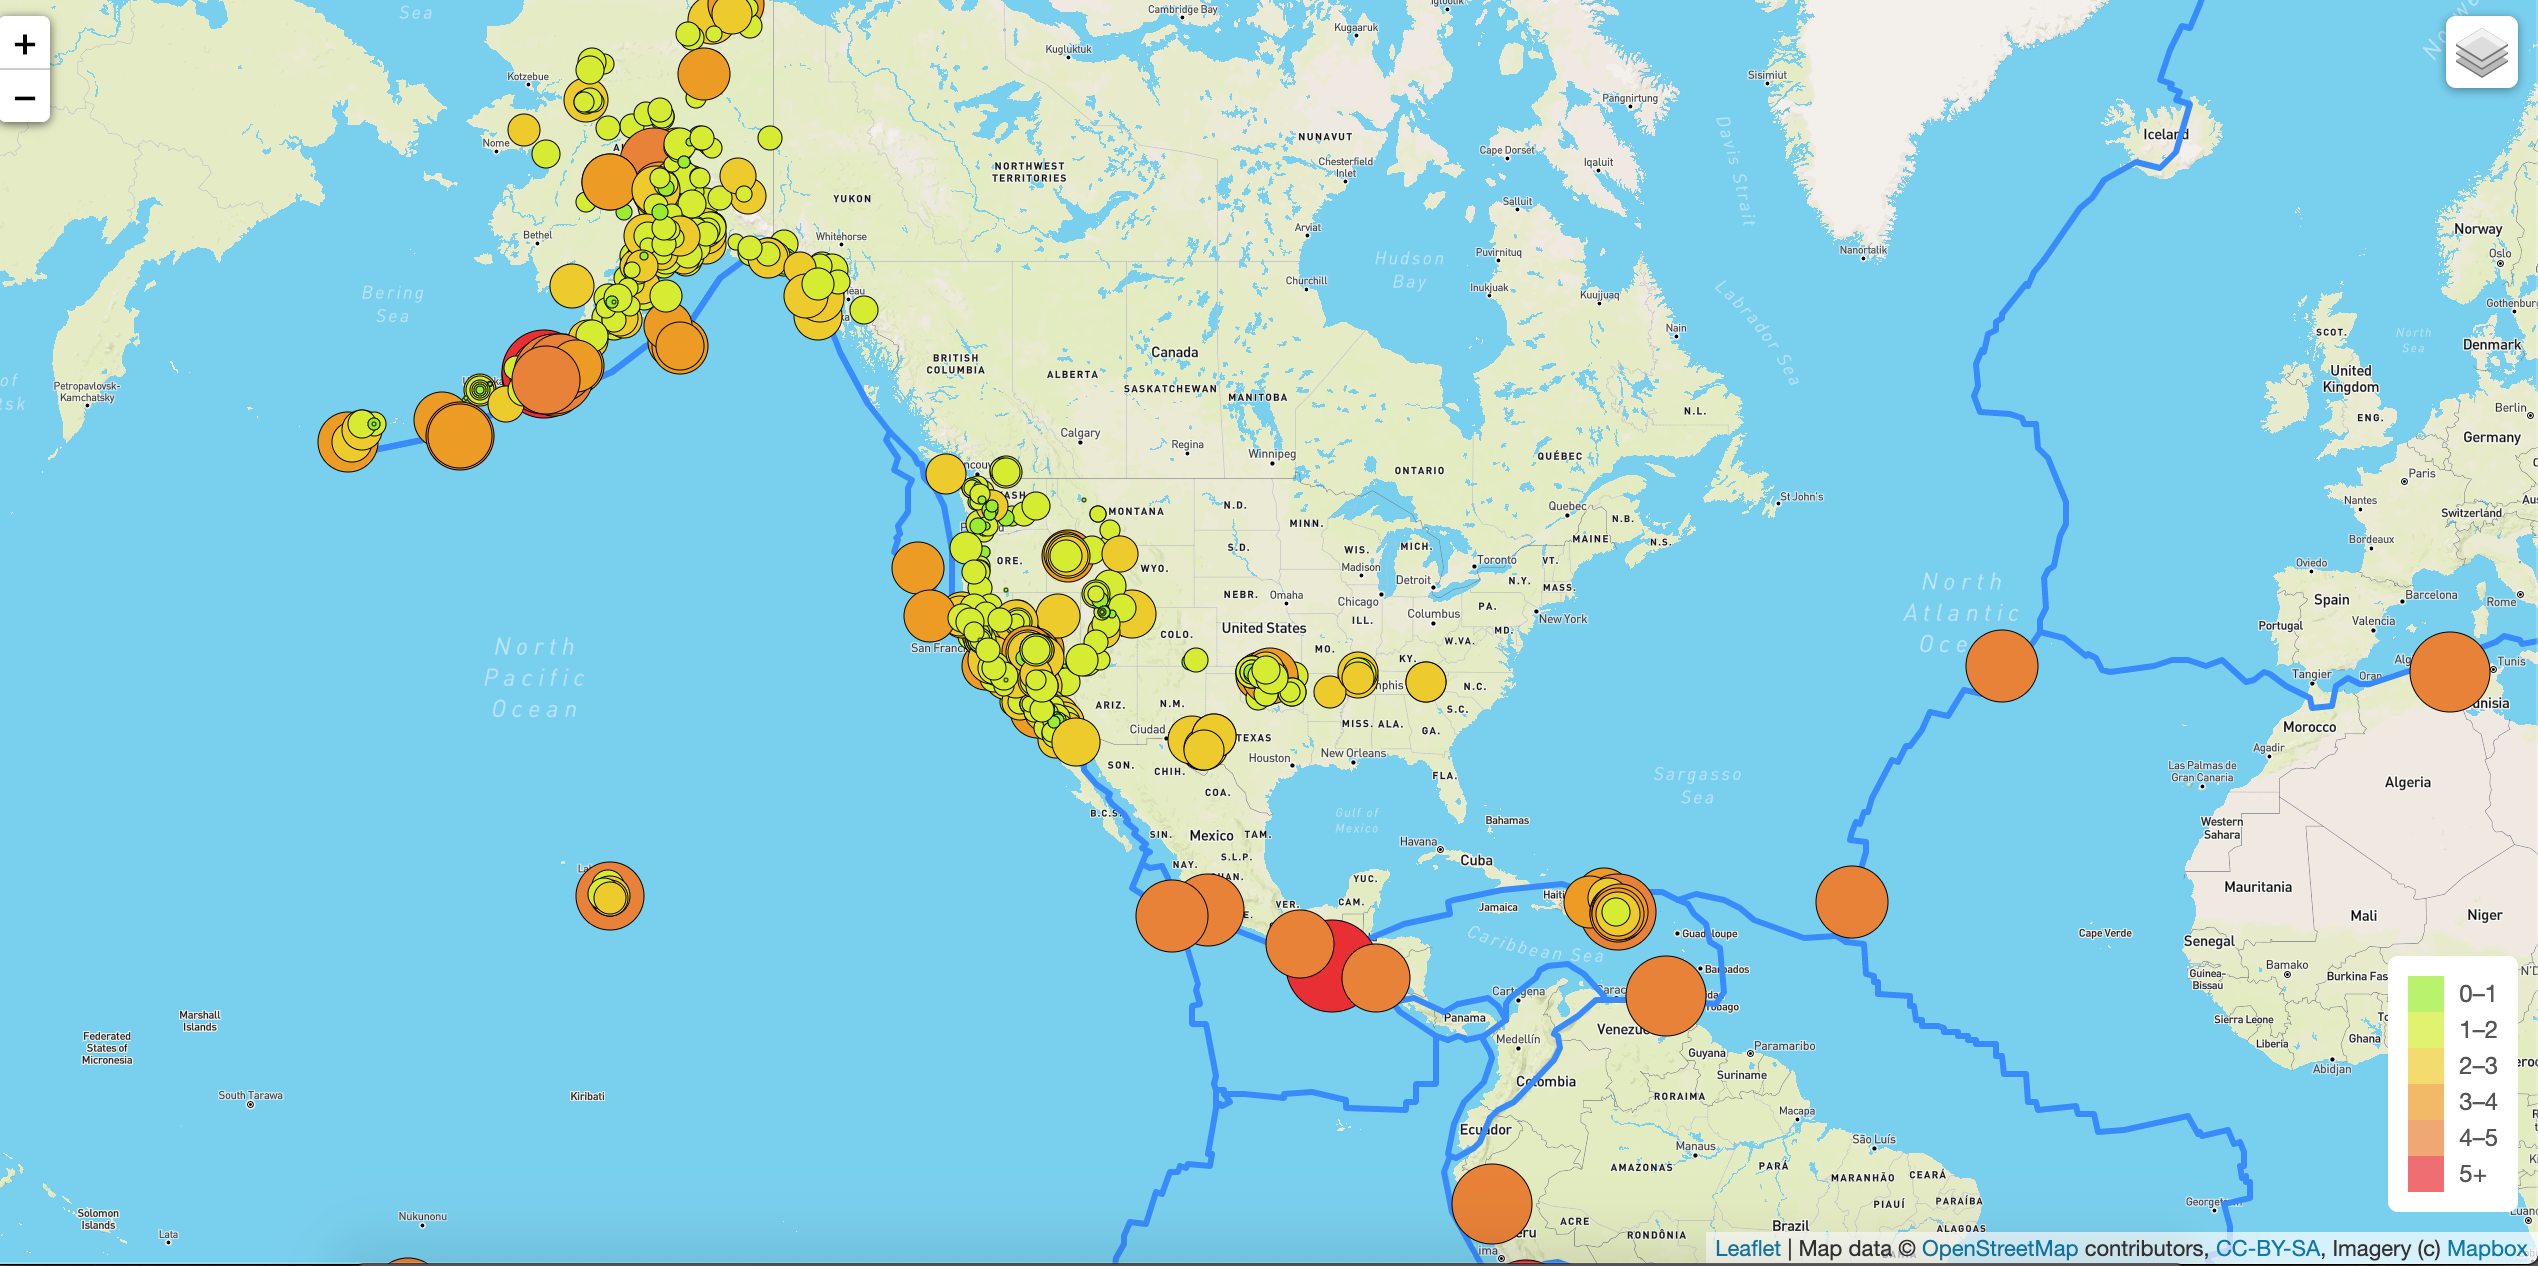
When you load the page, it defaults to the Streets view with both the Earthquakes and Tectonic Plate overlays engaged. The legend shows you the color coding for various magnitudes.

You can select one of four different different map styles, such as the Dark theme shown below:

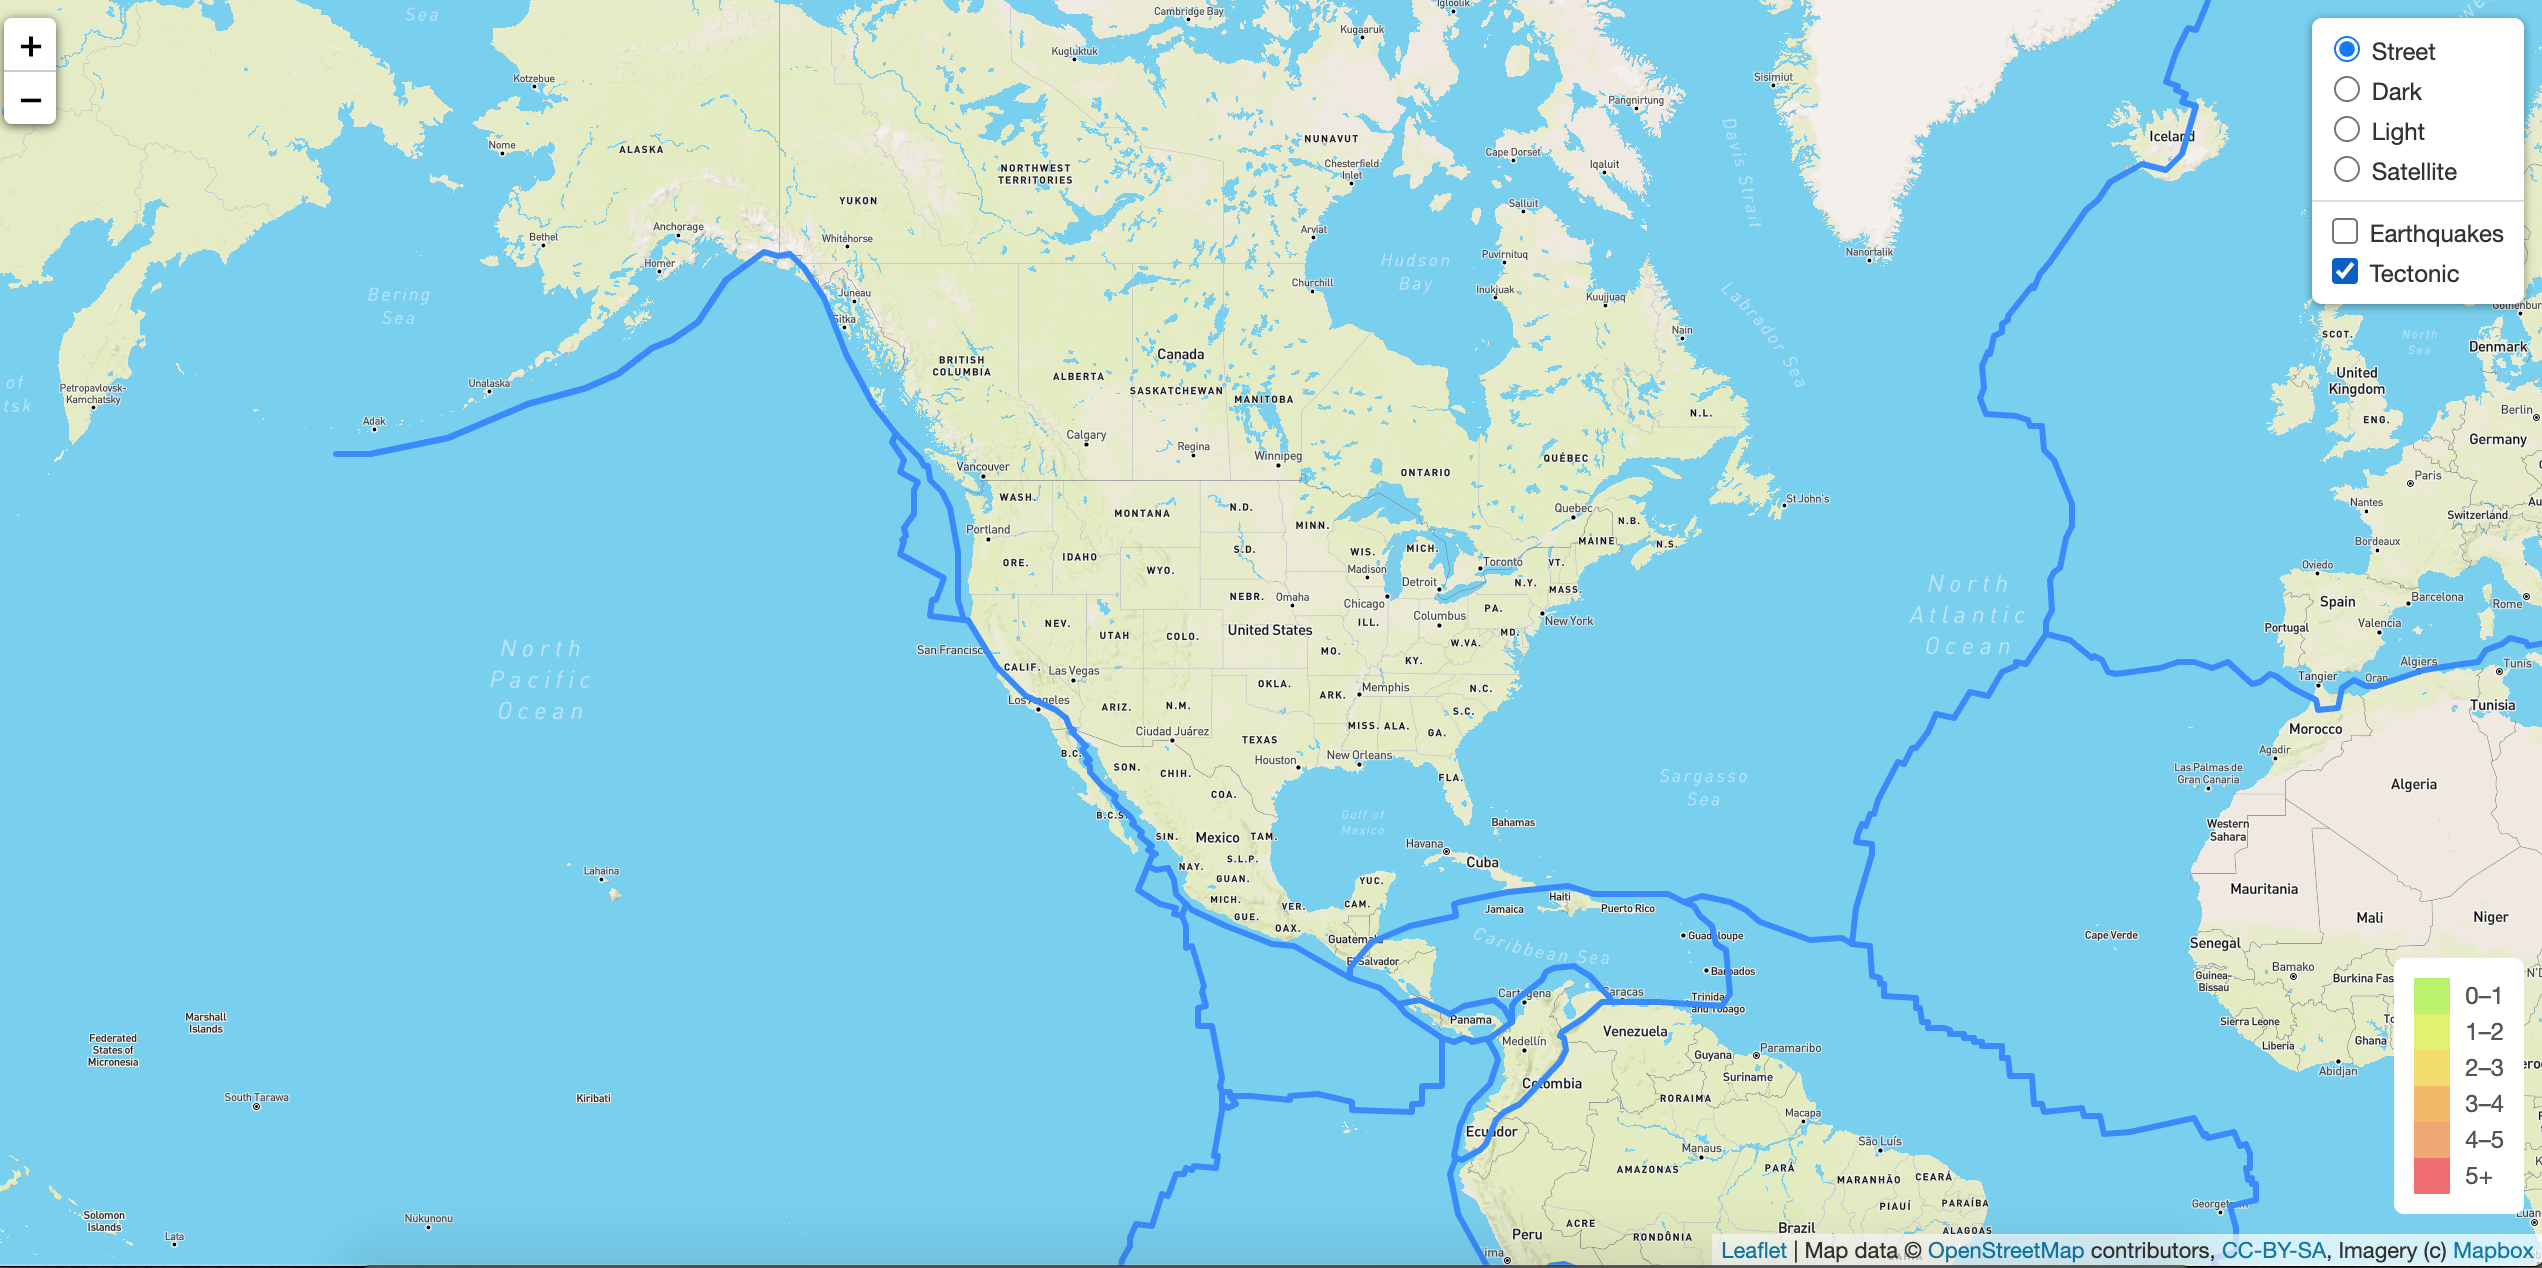
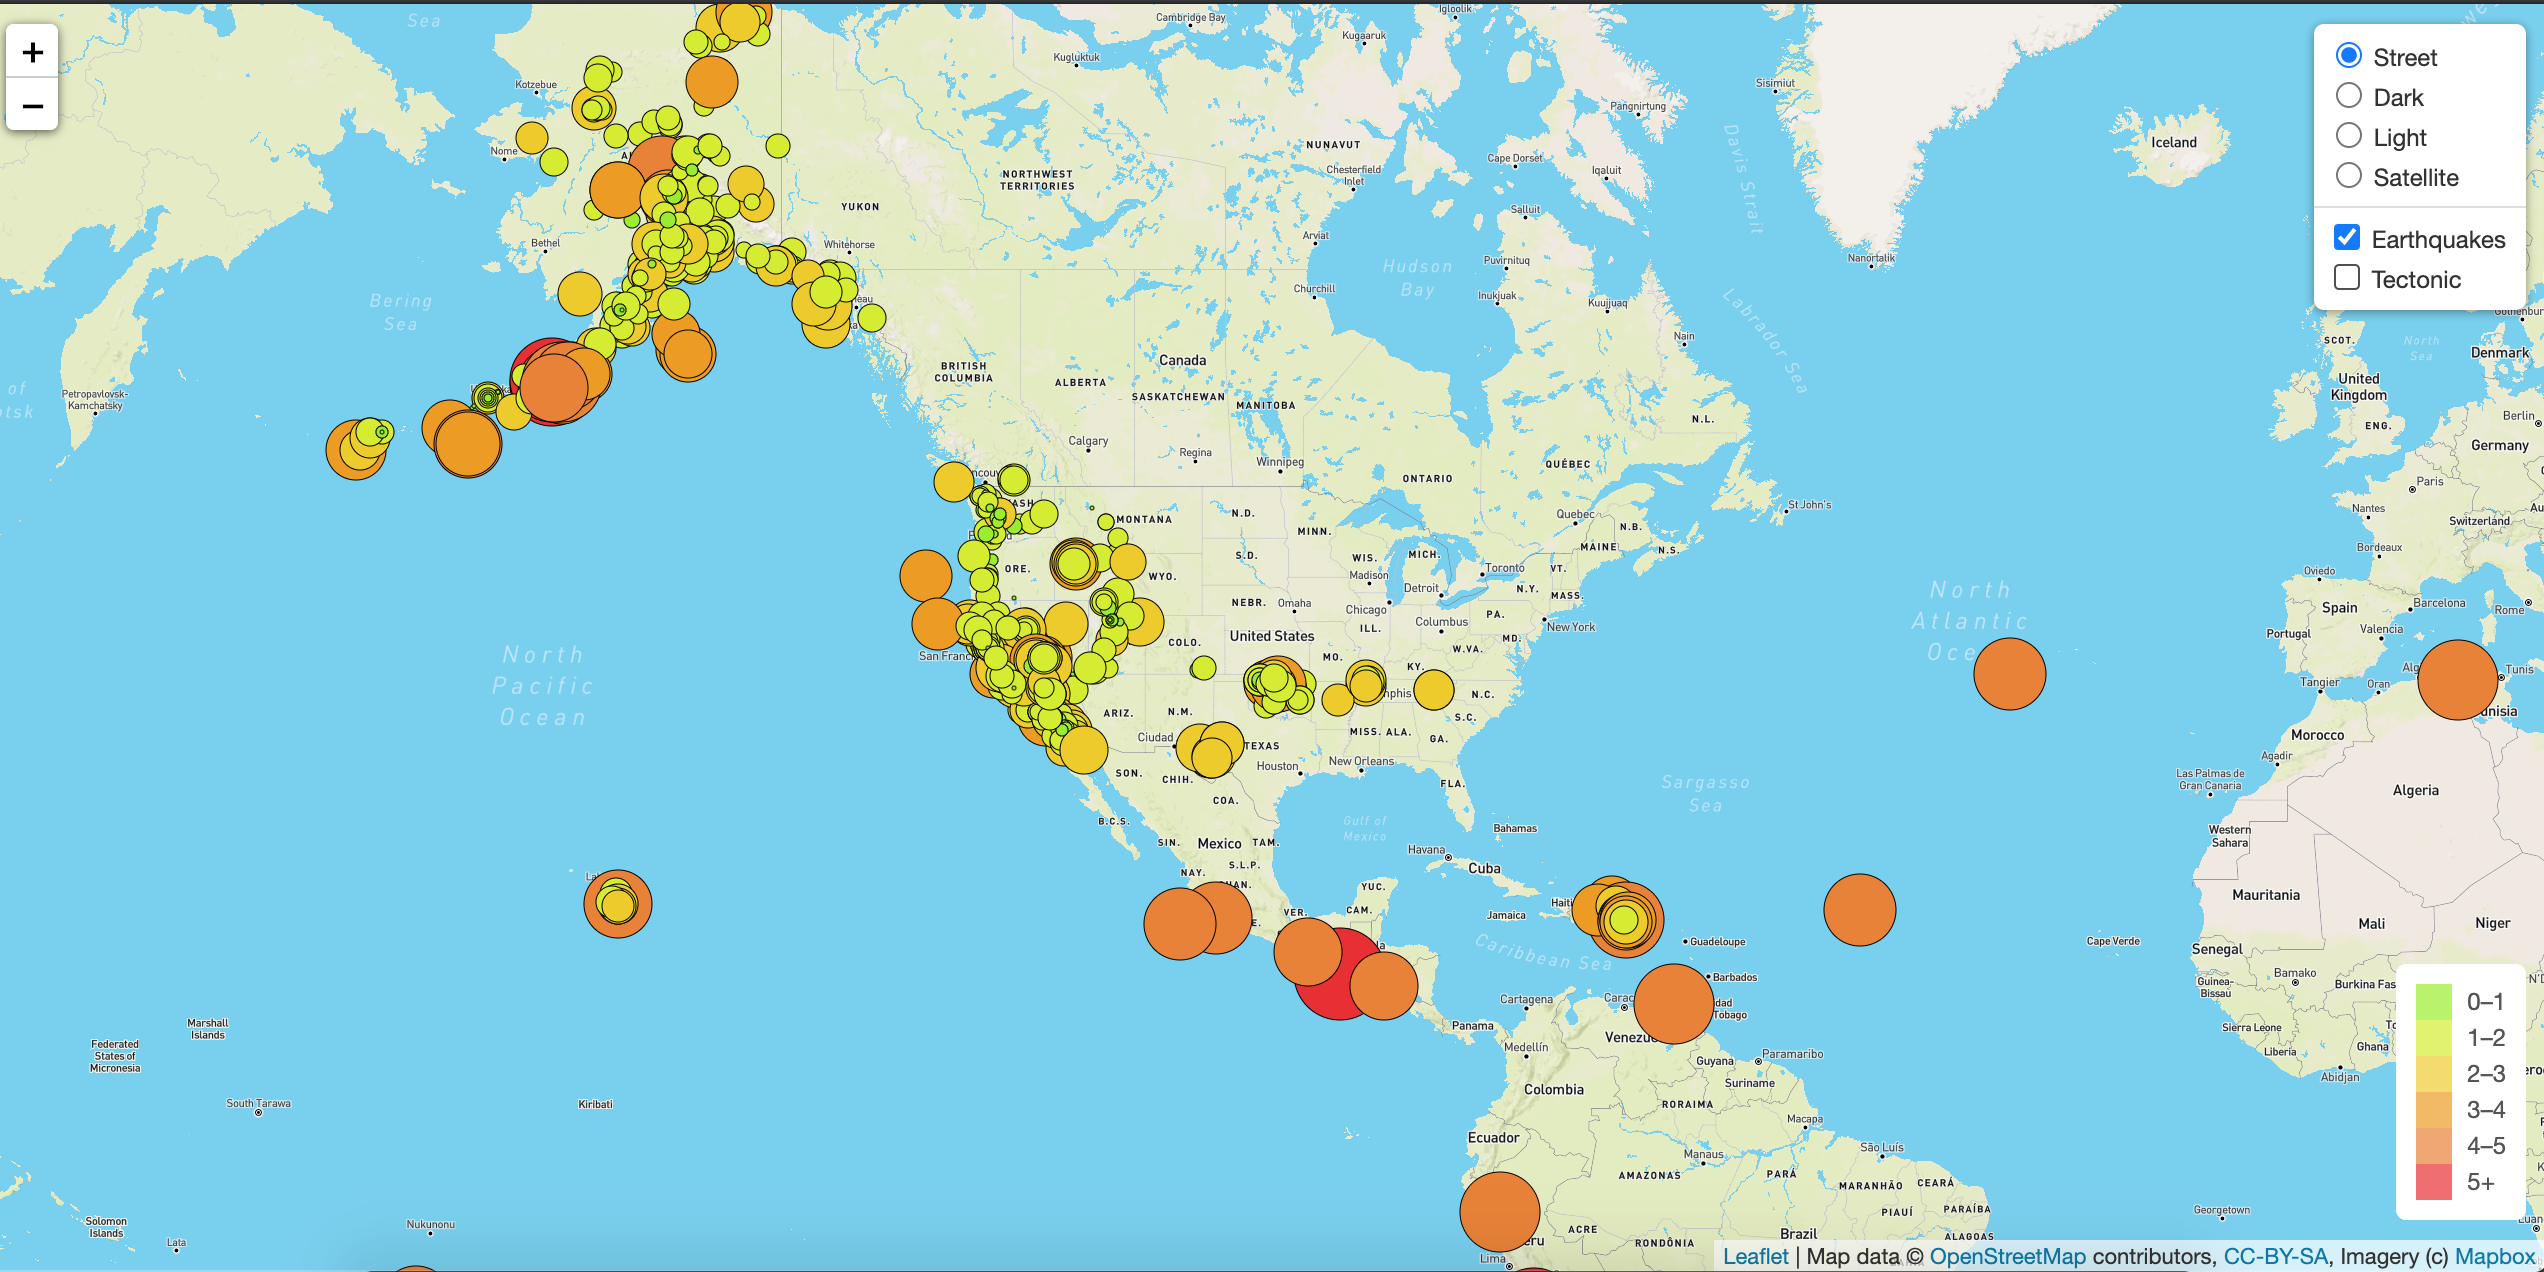
You can also toggle the Earthquakes to show or not-show, as well as the Tectonic Plates.

